
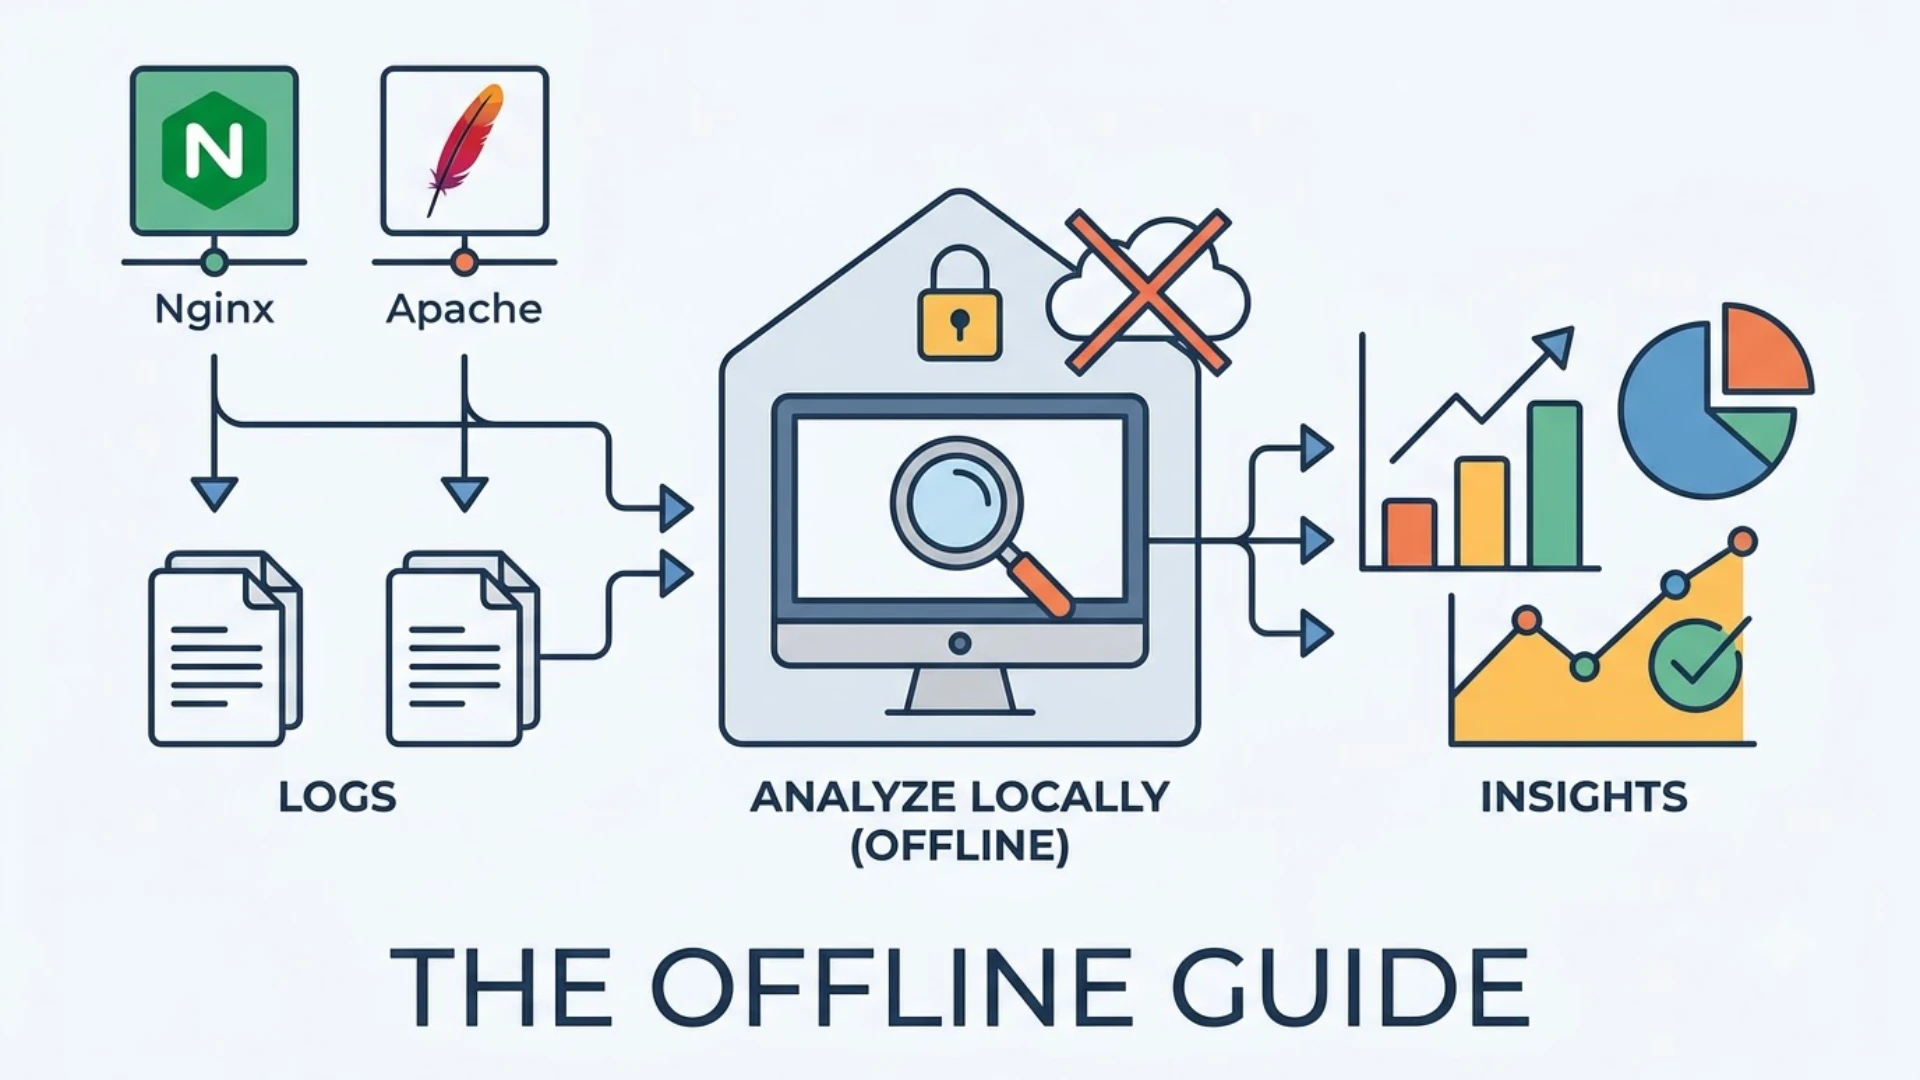
It’s 2:00 AM. Your monitoring dashboard is flashing red, indicating a spike in 502 Bad Gateway errors. You need to find out exactly which upstream server is failing and what specific endpoint is triggering the cascade.
Your first instinct might be to open your centralized logging SaaS. But the UI is sluggish. The query times out. Suddenly, you’re staring at a billing dashboard realizing your log ingestion costs have tripled this month because someone forgot to filter out health-check pings.
There is a better way. You can bypass the cloud, ignore the SaaS bills, and analyze nginx logs locally in seconds.
The modern DevOps ecosystem has conditioned us to believe that log analysis requires a massive, centralized, cloud-hosted stack. But for deep-dive troubleshooting, security audits, and compliance checks, a local-first approach is often faster, cheaper, and significantly more secure. Whether you are dealing with an air-gapped environment, trying to avoid uploading PII to a third-party vendor, or just want to parse web server logs offline without waiting for indexers to catch up, local analysis is an essential skill.
This guide strips away the SaaS marketing fluff. We’ll cover everything from advanced CLI one-liners to using a full nginx access log sql parser locally, ensuring you can extract actionable intelligence from raw text files, no matter the size.
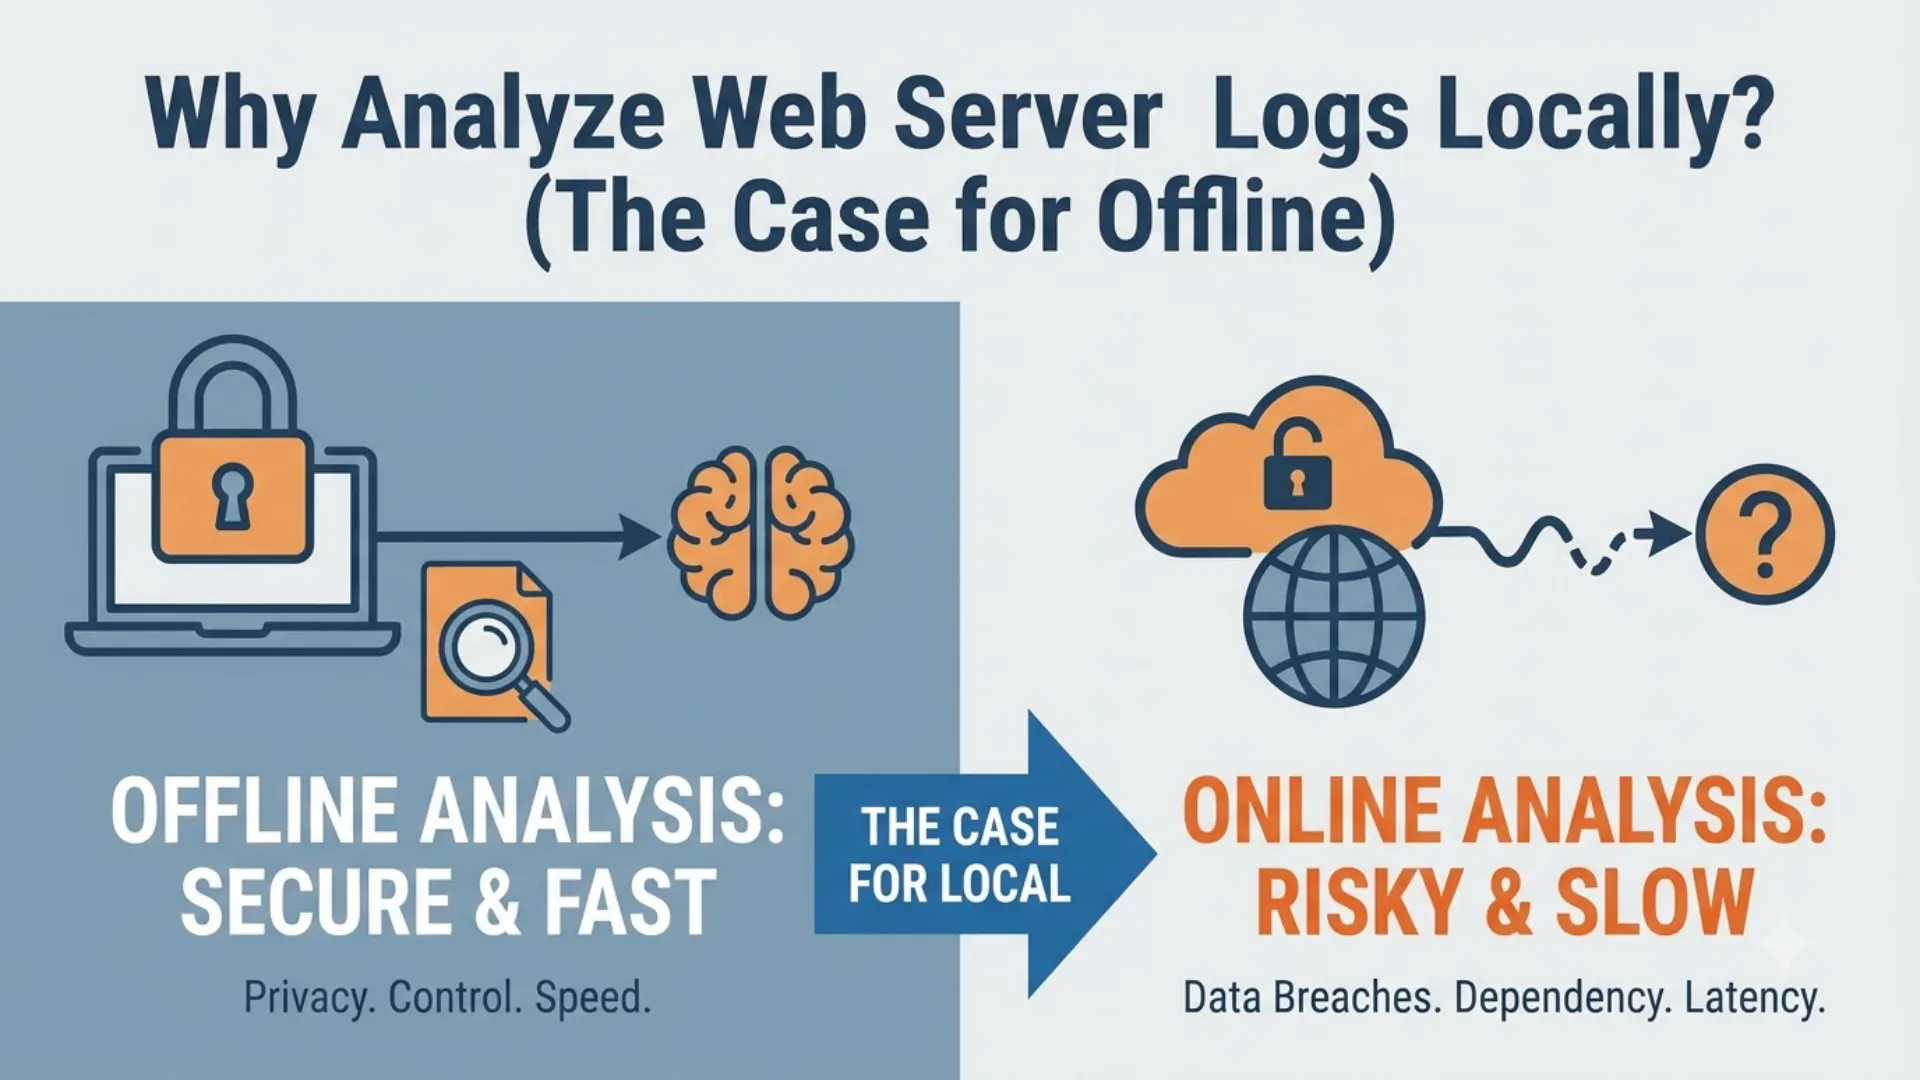
Why Analyze Web Server Logs Locally? (The Case for Offline)
Before we dive into the tools, let’s address the philosophy. Why pull a 10GB log file to your local machine when you have a centralized SIEM?
1. Zero-Trust and Data Residency
Web server logs are notoriously dirty. They capture raw URLs, which often include query parameters containing session tokens, email addresses, or internal API keys. Uploading these logs to a US-based SaaS provider might violate GDPR, HIPAA, or your company's internal zero-trust policies. By choosing to parse web server logs offline, you keep sensitive data within your physical or logical perimeter.
2. Eliminating SaaS Log Bloat
Centralized logging is expensive. You pay for ingestion, indexing, and storage. When you need to do a one-off forensic analysis of a specific week's traffic, running that query in a tool like Splunk or Datadog can cost hundreds of dollars in compute. Downloading the raw file and analyzing it locally costs nothing but your local CPU cycles.
3. Speed and Agility
Centralized tools require logs to be shipped, parsed, indexed, and stored before you can query them. If you need to analyze a log file right now, waiting for a 15-minute ingestion pipeline is unacceptable. Local analysis is instantaneous.
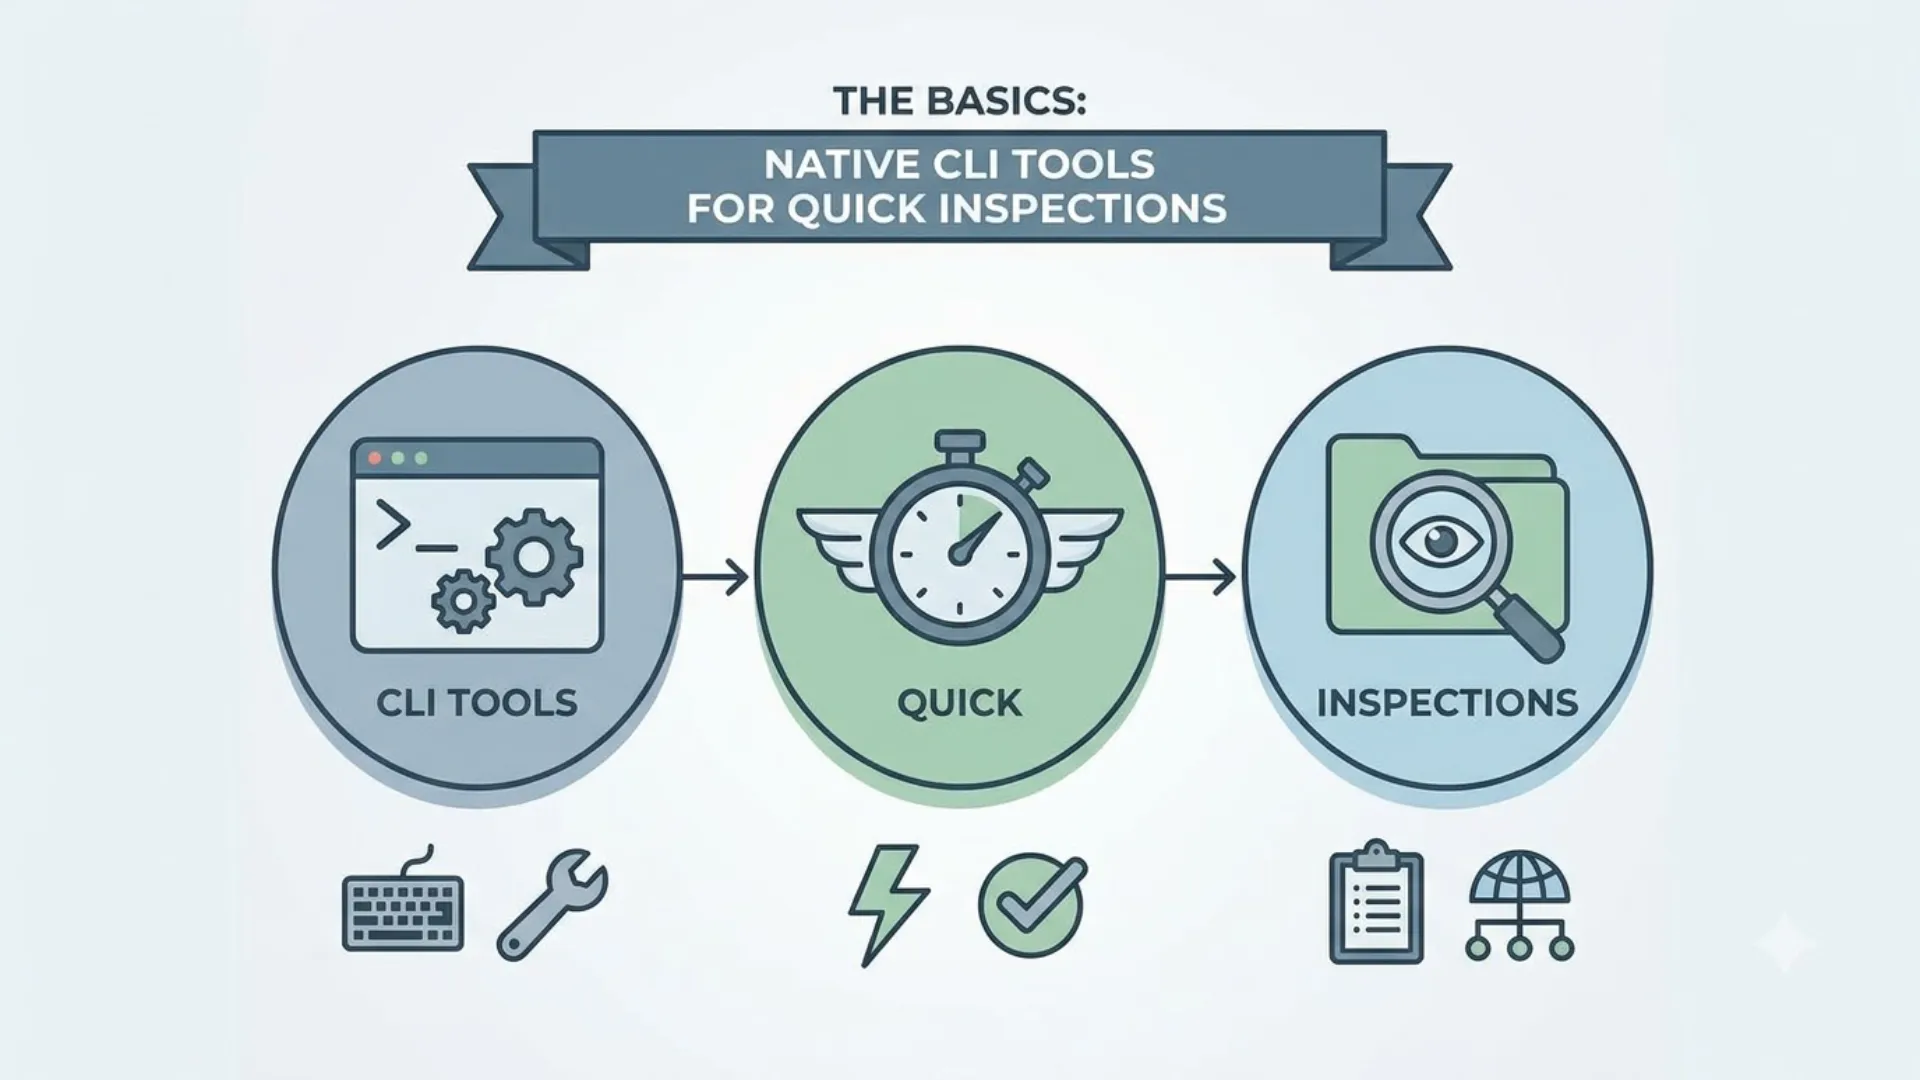
The Basics: Native CLI Tools for Quick Inspections
Every sysadmin knows grep. But when you need to analyze nginx logs locally, basic pattern matching isn't enough. You need to extract, transform, and aggregate data on the fly.
Advanced AWK for Log Parsing
awk is the undisputed king of quick, local text processing. Nginx combined log format typically looks like this:
192.168.1.1 - - [10/Oct/2023:13:55:36 -0700] "GET /api/v1/users HTTP/1.1" 200 1234 "-" "Mozilla/5.0"If you want to find the top 10 IP addresses hitting your server, you don't need a database. You need this one-liner:
awk '{print $1}' access.log | sort | uniq -c | sort -nr | head -n 10
But what if you want to calculate the average response time? If your Nginx log format includes $request_time at the end of the line, you can calculate the average locally without loading the file into memory:
awk '{ sum += $NF; n++ } END { if (n > 0) print sum/n }' access.log
Pro-tip: $NF refers to the last field in the line. Always verify your log format to ensure the response time is actually the last column.
The Power of xargs and zgrep
Log files are almost always rotated and compressed (.gz). Never decompress a 20GB log file just to search it; you'll waste disk I/O and time. Use zgrep to search compressed files directly:
zgrep "HTTP/1.1\" 50" access.log.*.gz
If you need to run a complex awk command across multiple compressed files, combine it with xargs to utilize all your CPU cores:
ls access.log.*.gz | xargs -P 8 -I {} sh -c 'zcat "{}" | awk "{print \$1}"' | sort | uniq -c | sort -nr | headThis spins up 8 parallel processes, drastically reducing the time it takes to analyze nginx logs locally when dealing with rotated archives.
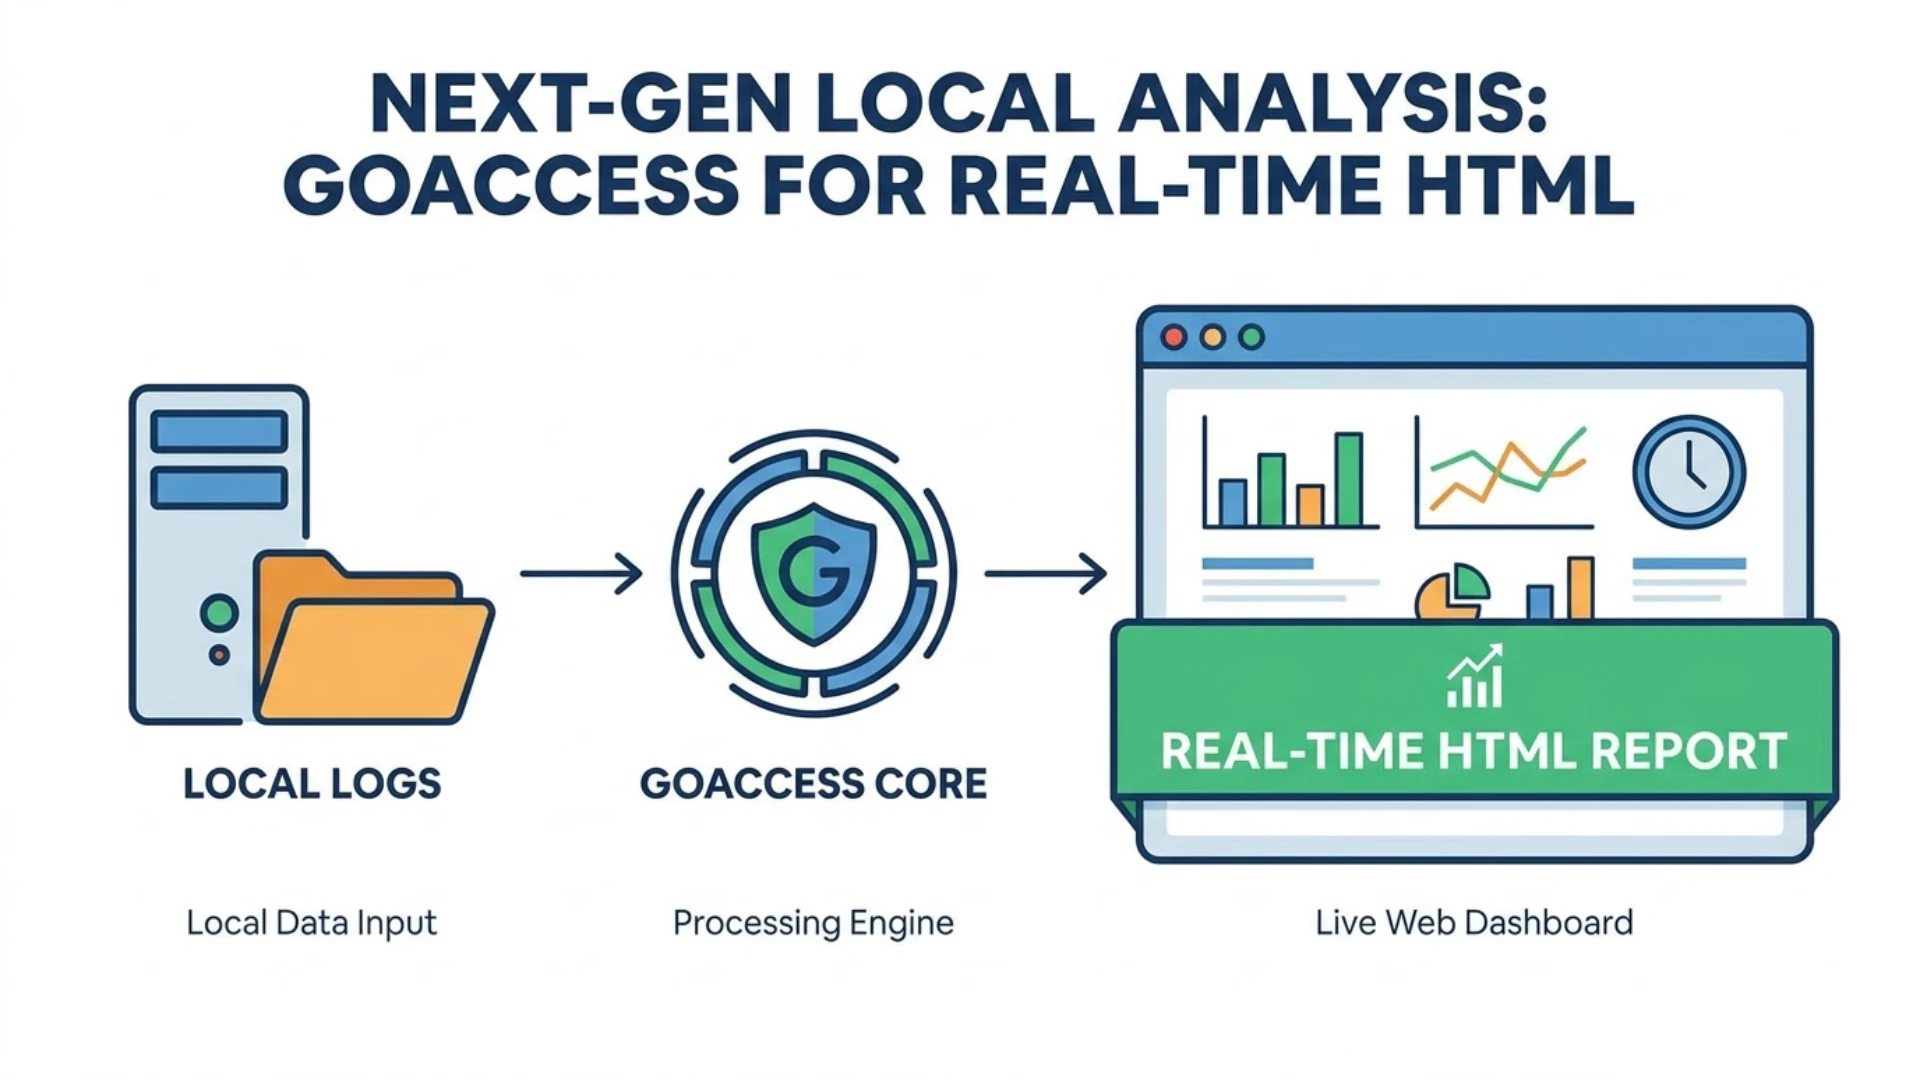
Next-Gen Local Analysis: GoAccess for Real-Time HTML
If you want visual insights without setting up Kibana or Grafana, GoAccess is the gold standard for local log analysis. It’s a terminal-based, real-time log analyzer that can also output beautiful, static HTML dashboards.
Configuring GoAccess for Nginx and Apache
The biggest hurdle with GoAccess is the log format configuration. If you get this wrong, the parser fails silently or outputs garbage.
For a standard Nginx combined log format, create a ~/.goaccessrc file:
log-format %h %^[%d:%t %^] "%r" %s %b "%R" "%u"
date-format %d/%b/%Y
time-format %H:%M:%S
For Apache, if you are using the Common Log Format:
log-format %h %l %u %t \"%r\" %>s %bGenerating a Static HTML Report
The real magic happens when you generate a static report. This is perfect for sharing with non-technical stakeholders without giving them SSH access.
goaccess access.log -o report.html --log-format=COMBINED --real-time-htmlHandling Large Files: GoAccess is highly optimized. It uses an in-memory hash table. However, if you feed it a 50GB file, it will consume a proportional amount of RAM. We’ll cover memory management for massive files later in this guide.
The Power Move: Using an Nginx Access Log SQL Parser
This is where we separate the amateurs from the experts. Regular expressions are brittle. If your log format changes slightly, your awk scripts break.
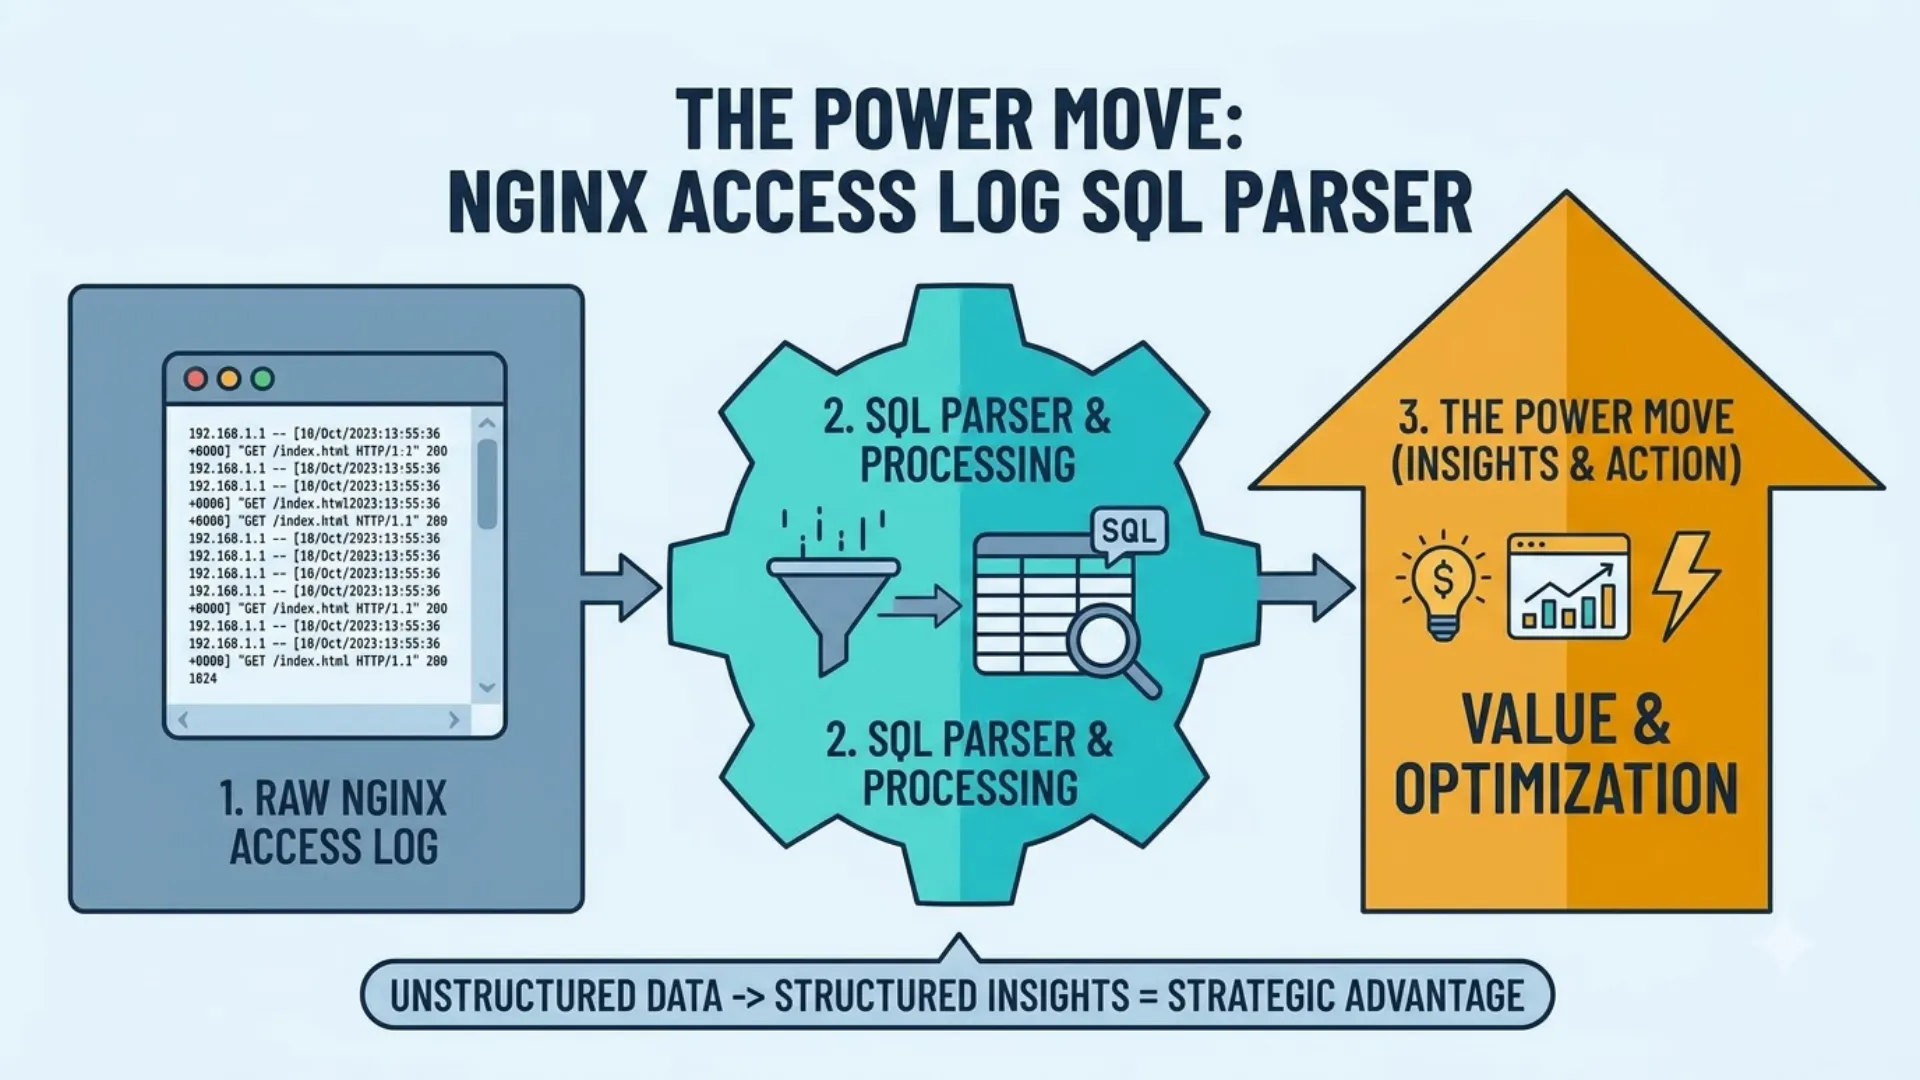
What if you could query your raw text logs using standard SQL? Enter the nginx access log sql parser.
Tools like DuckDB, q, and textql allow you to treat raw log files as relational databases. You can write JOINs, GROUP BY clauses, and window functions directly against a text file on your hard drive.
DuckDB: The Ultimate Local SQL Engine
DuckDB is an in-process SQL OLAP database management system. It is incredibly fast, requires no server setup, and can query raw text files directly. It is arguably the most powerful tool to parse web server logs offline.
Step 1: Install DuckDB
On macOS: brew install duckdb
On Linux: Download the binary directly from DuckDB GitHub releases.
Step 2: Querying the Log File
Nginx logs are space-delimited, but the HTTP request string contains spaces inside quotes. Standard CSV parsing will fail. DuckDB handles this elegantly using regex extraction or custom quoting.
Here is the most robust way to query an Nginx log with DuckDB:
-- Open duckdb in your terminal
duckdb

-- Create a view that parses the log using regex
CREATE VIEW nginx_logs AS
SELECT
    regexp_extract(line, '^(.*?) ', 1) AS ip_address,
    regexp_extract(line, '\[(.*?)\]', 1) AS timestamp,
    regexp_extract(line, '"(.*?)"', 1) AS request,
    regexp_extract(line, '" (\d{3}) ', 1)::INT AS status_code,
    regexp_extract(line, '" (\d{3}) (\d+) ', 2)::INT AS bytes_sent
FROM read_lines('access.log');
Step 3: Run Complex Analytics
Now that your log is a SQL table, the possibilities are endless.
Find the top 5 endpoints returning 404 errors:
SELECT
    regexp_extract(request, 'GET (.*?) HTTP', 1) AS endpoint,
    COUNT(*) as hits
FROM nginx_logs
WHERE status_code = 404
GROUP BY endpoint
ORDER BY hits DESC
LIMIT 5;
Calculate the 95th percentile of bytes sent per IP:
SELECT
    ip_address,
    QUANTILE_CONT(bytes_sent, 0.95) as p95_bytes
FROM nginx_logs
GROUP BY ip_address
HAVING COUNT(*) > 100
ORDER BY p95_bytes DESC;
This approach completely eliminates the need to write fragile awk scripts. If your log format changes, you just update the regex in your SQL view. It is the most flexible way to analyze nginx logs locally.
Alternative: q (Text as Tables)
If DuckDB feels too heavy, q is a lightweight command-line tool that allows direct SQL execution on text files.
q -d " " "SELECT c1, COUNT(*) FROM access.log WHERE c9 = '404' GROUP BY c1 ORDER BY COUNT(*) DESC LIMIT 10"
While faster to type, q lacks the advanced regex extraction capabilities of DuckDB, making it less ideal for complex web server logs where fields contain spaces.
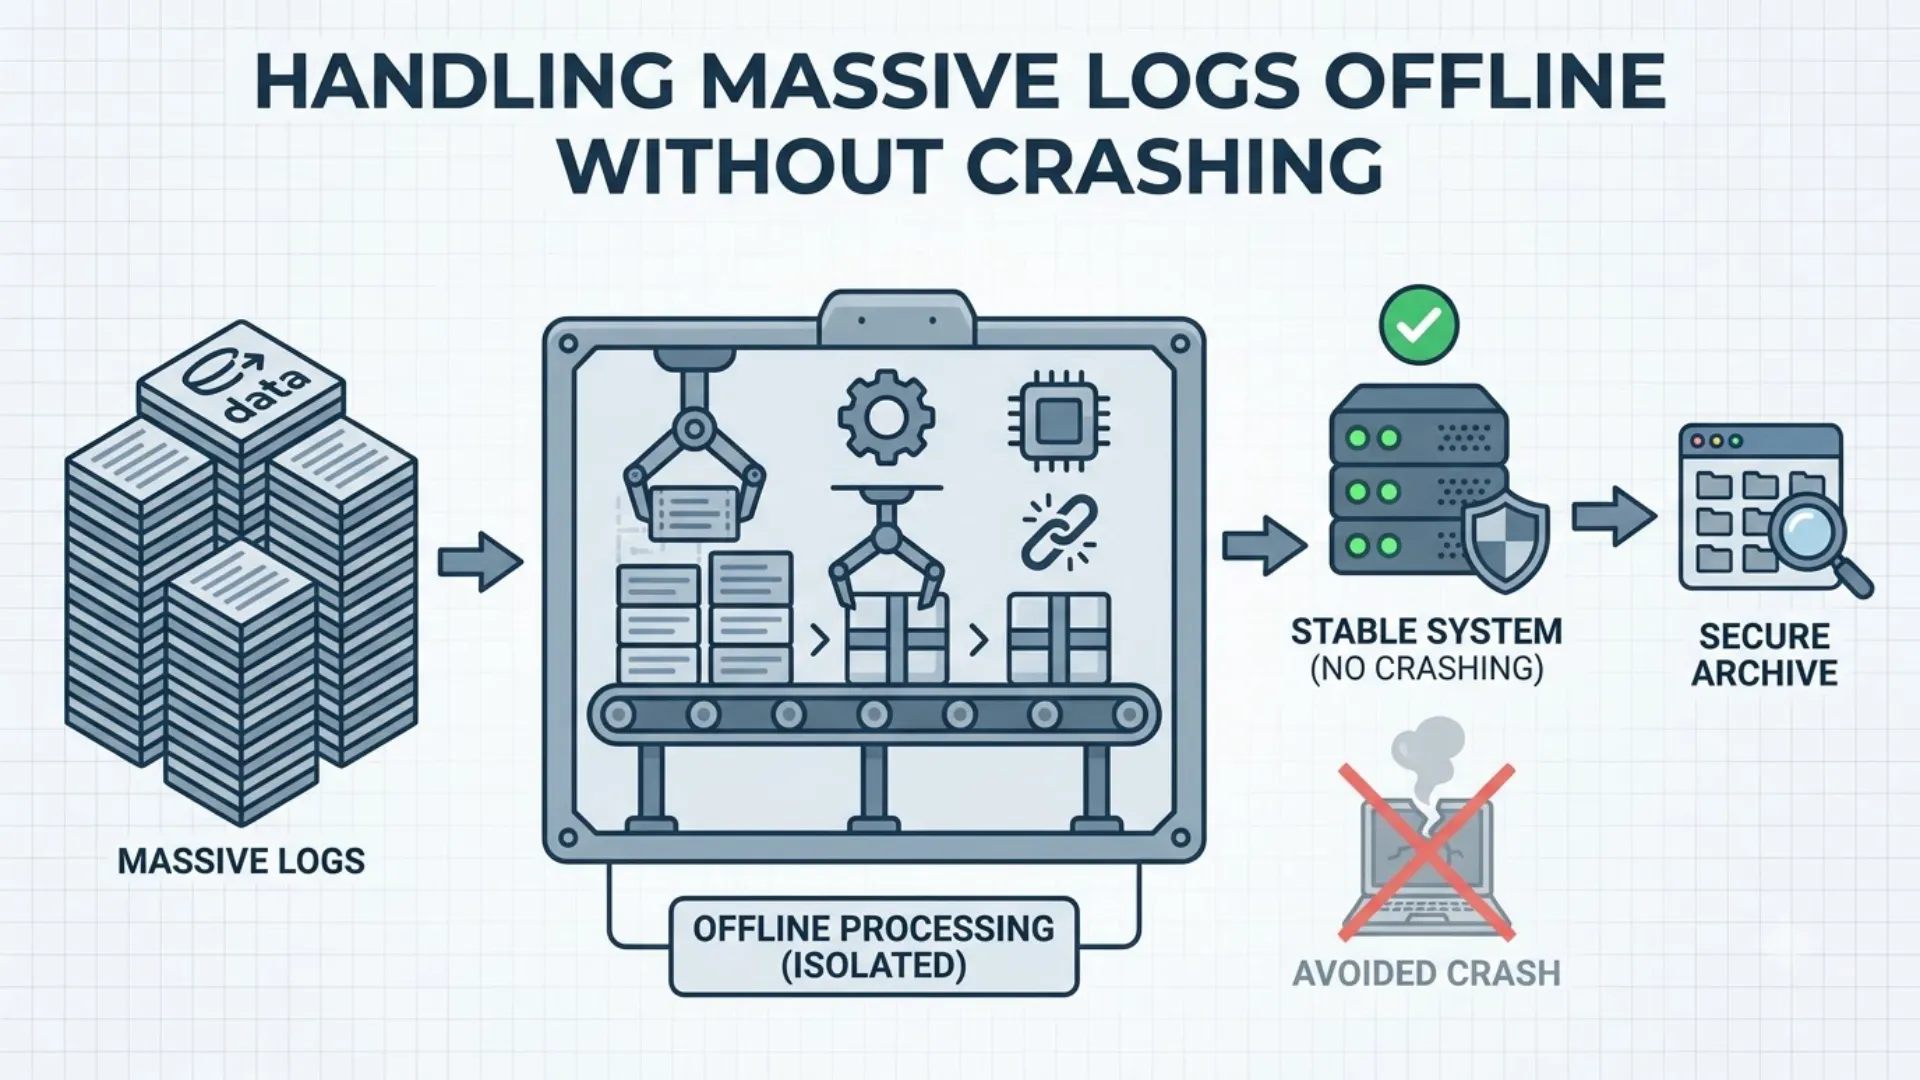
Handling Massive Logs Offline Without Crashing
A common mistake when attempting to parse web server logs offline is treating a 30GB log file like a 30MB file. If you try to load a massive log into Python’s Pandas or an unoptimized tool, your machine will hit an Out-Of-Memory (OOM) error and crash.
Here is how to handle massive files locally without blowing up your RAM.
1. Stream, Don't Load
Tools like GoAccess and DuckDB are designed to stream data chunk by chunk. If you are writing a custom Python script, never use file.read(). Always iterate line by line:
# BAD: Loads 30GB into RAM
with open('access.log', 'r') as f:
    lines = f.readlines()

# GOOD: Streams line by line, uses almost zero RAM
with open('access.log', 'r') as f:
    for line in f:
        process(line)
2. Use Memory-Mapped Files (mmap)
If you need random access to a massive log file (e.g., jumping to a specific byte offset), use memory mapping. The OS handles paging the file in and out of RAM. In Python, the mmap module makes this trivial. DuckDB also utilizes mmap under the hood for its high performance.
3. Chunking with GNU Parallel
If you have a multi-core server and a 100GB log file, you can split the file and process it in parallel:
# Split the file into 500MB chunks
split -b 500M access.log chunk_

# Process chunks in parallel using GNU parallel
parallel --jobs 64 'goaccess {} -o {}.html' ::: chunk_*
Note: When splitting logs, ensure you don't cut a line in half. Using split -l (line count) or tools like pigz (parallel gzip) is safer for log integrity.
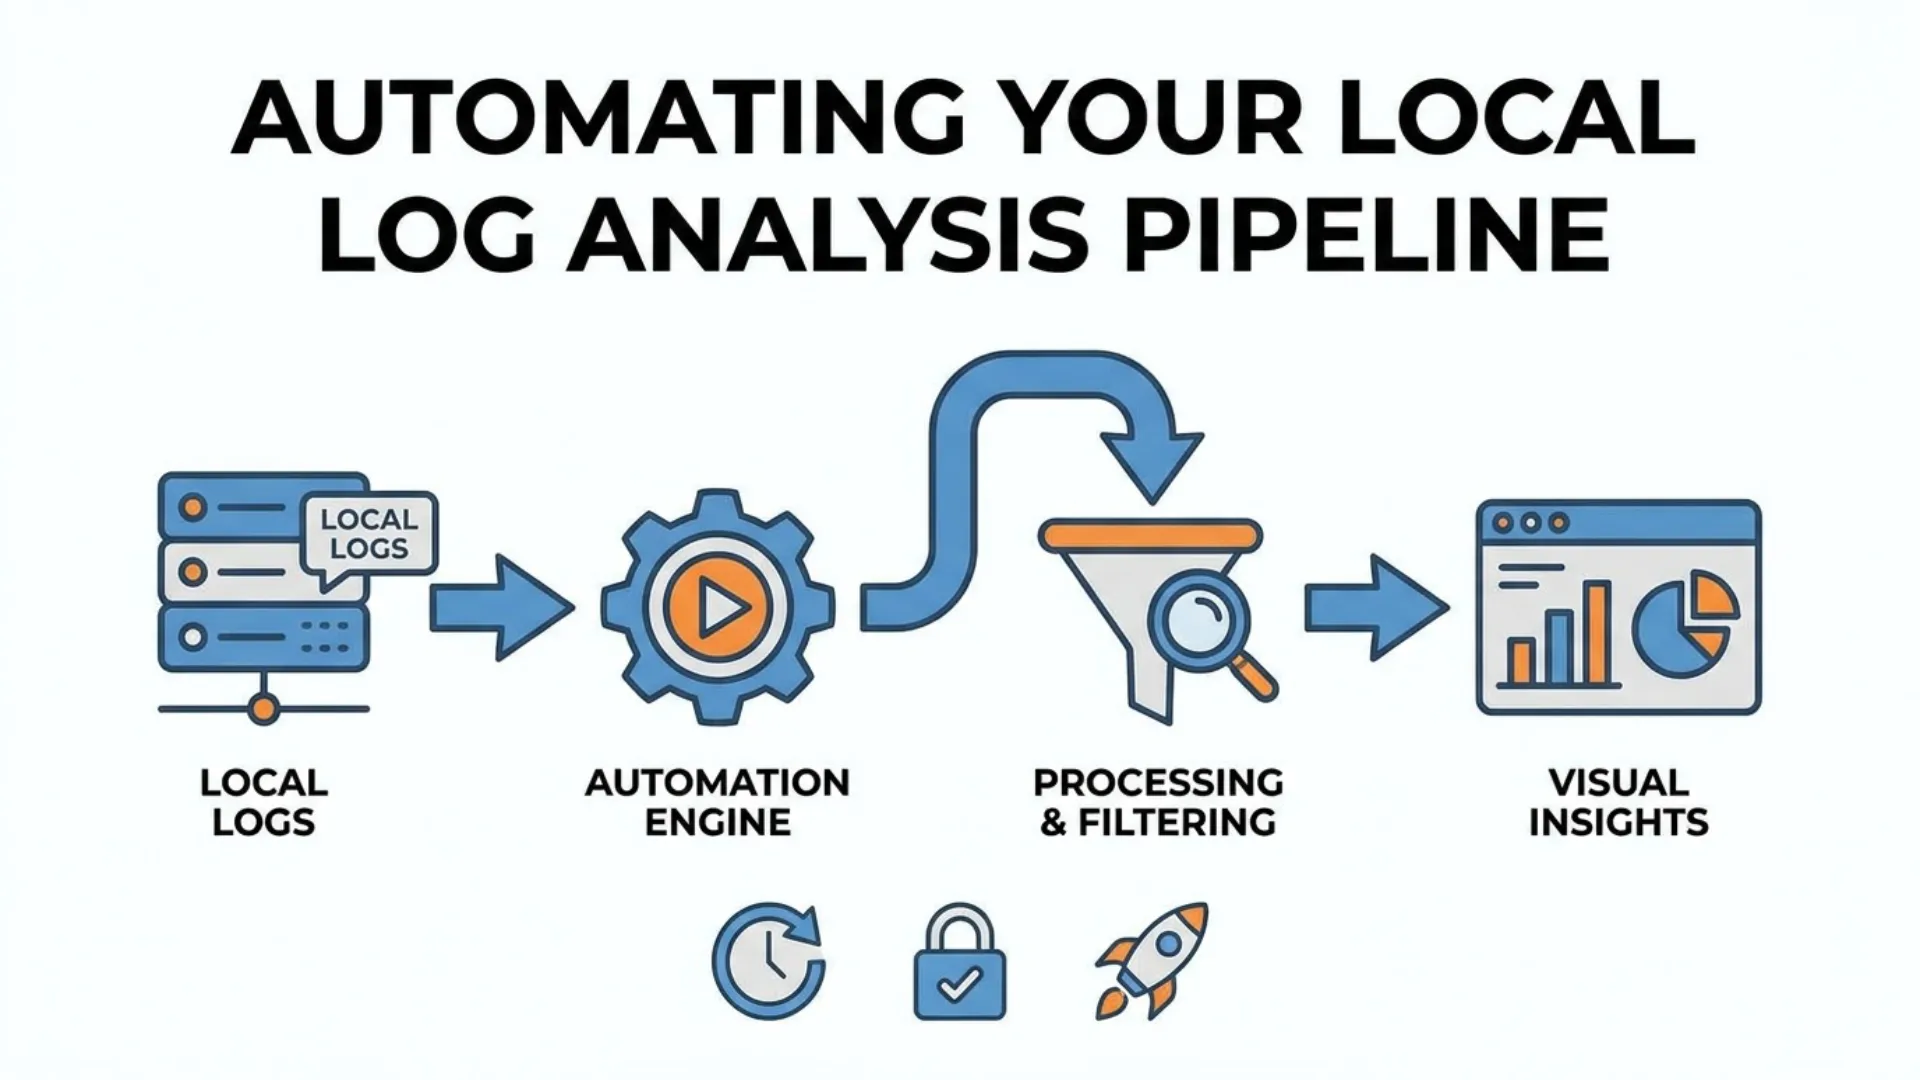
Automating Your Local Log Analysis Pipeline
You don't need a centralized SIEM to get automated daily reports. You can build a highly effective, zero-cost local pipeline using cron, shell scripts, and local mail transfer agents (MTAs).
The Local Cron Pipeline
Imagine a script that runs every night at 1:00 AM, analyzes the previous day's Nginx logs, generates an HTML report, and emails it to the DevOps team.
1. The Script (daily_log_report.sh)
#!/bin/bash
YESTERDAY=$(date -d "yesterday" +%Y-%m-%d)
LOG_FILE="/var/log/nginx/access.log"
REPORT_DIR="/var/www/html/reports"
REPORT_FILE="${REPORT_DIR}/report-${YESTERDAY}.html"

# Ensure report directory exists
mkdir -p $REPORT_DIR

# Generate GoAccess report for yesterday's data
grep "$YESTERDAY" $LOG_FILE | goaccess - -o $REPORT_FILE --log-format=COMBINED

# Email the report (assuming local msmtp or sendmail is configured)
echo "Daily log report for $YESTERDAY is ready." | mail -s "Daily Log Report" -a $REPORT_FILE devops-team@company.com
2. The Cron Job
0 1 * * * /path/to/daily_log_report.sh
This setup provides the visibility of a SaaS tool with the security and cost benefits of a local setup. You can host the /var/www/html/reports directory on an internal, authenticated Nginx server, giving your team a dashboard without ever sending data to the cloud.
Common Mistakes When Parsing Logs Locally
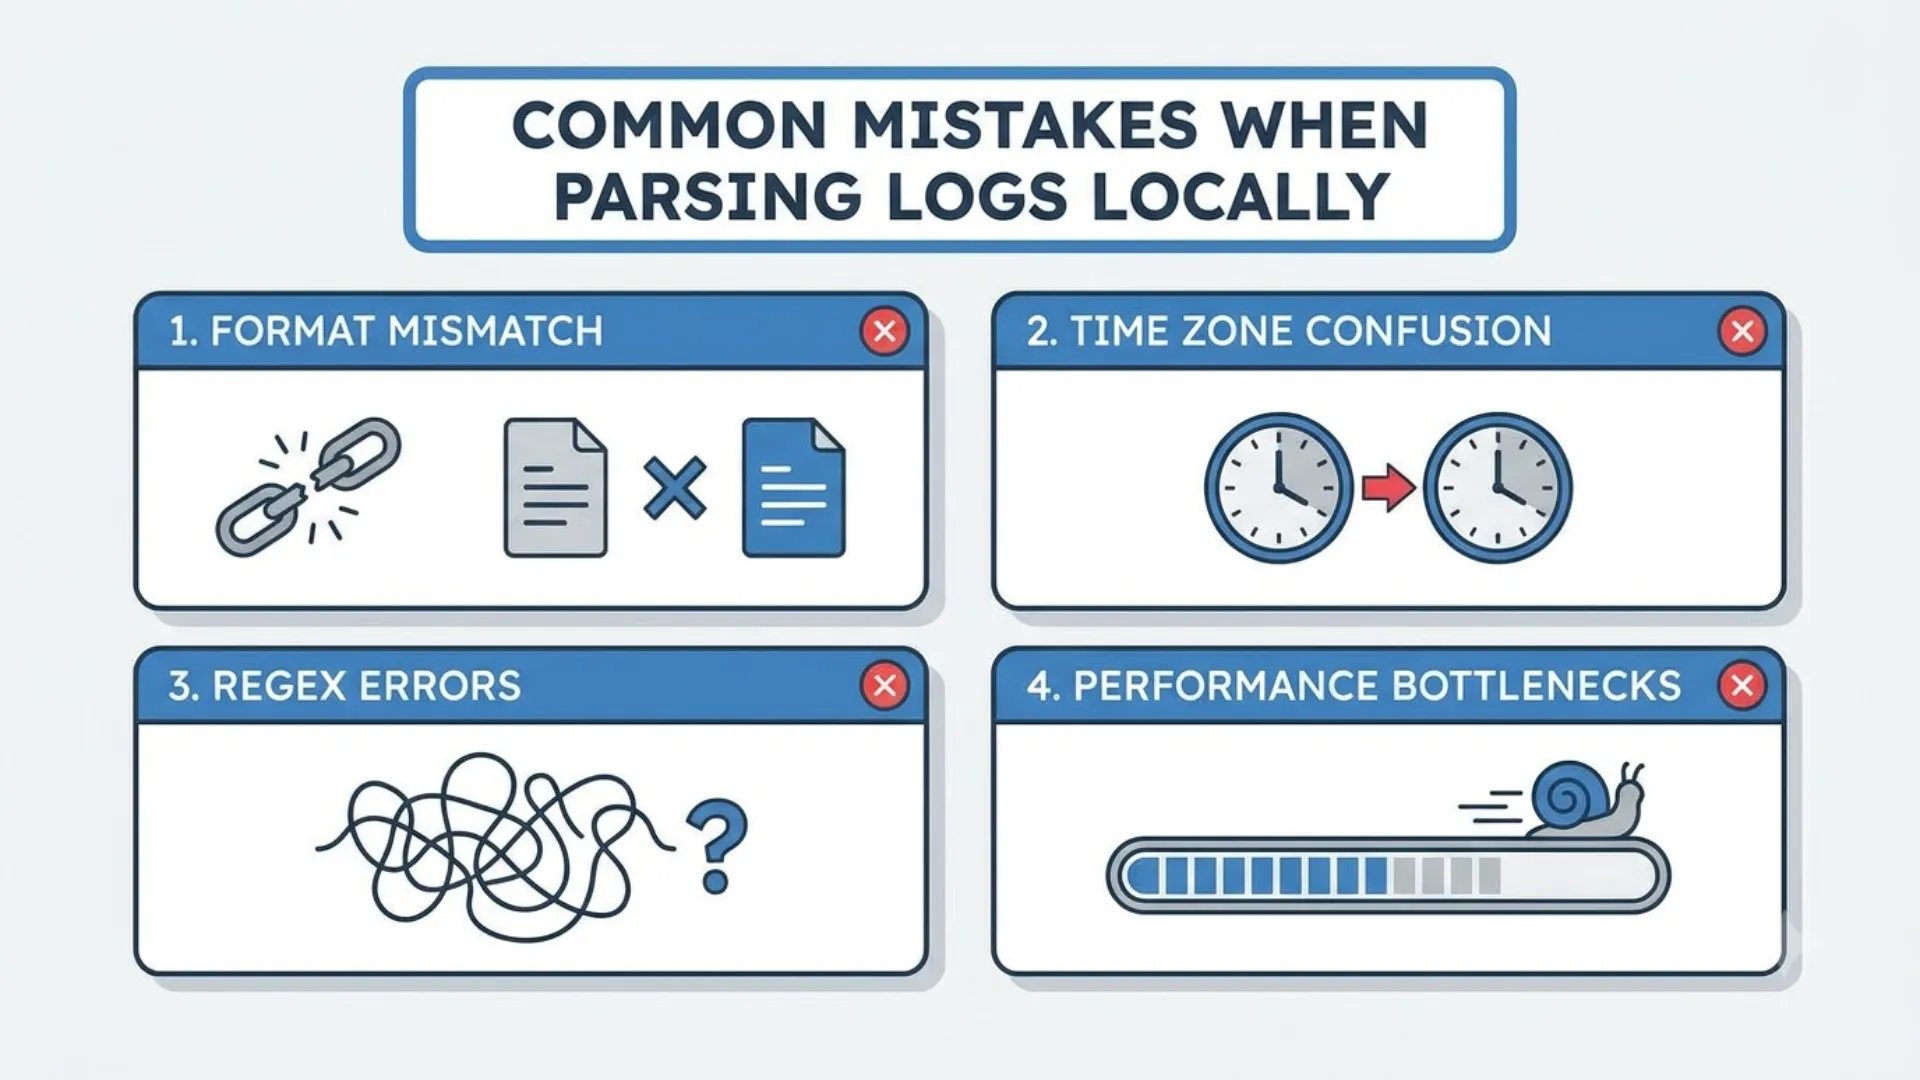
Even experienced sysadmins fall into traps when analyzing raw files. Avoid these common pitfalls:
1. Ignoring the X-Forwarded-For Header
If your Nginx/Apache server sits behind a load balancer (like AWS ALB or Cloudflare), the client IP in the log ($remote_addr) will be the load balancer's IP, not the actual user.
The Fix: Ensure your web server is configured to log the X-Forwarded-For or CF-Connecting-IP header, and update your parsing regex/scripts to look at that field instead of the default IP column.
2. Timezone Mismatches
Web servers often log in UTC, while your local machine is in EST or PST. When you filter logs by "today," you might accidentally exclude the last 8 hours of data.
The Fix: Always convert timestamps to a unified timezone during parsing, or explicitly filter using UTC timestamps. In DuckDB, you can cast the timestamp string and apply timezone offsets directly in SQL.
3. Failing to Decode URLs
Logs record URLs exactly as received. A search for /api/v1/user profile will fail because the log actually contains /api/v1/user%20profile.
The Fix: If you are doing deep content analysis, ensure your parsing tool URL-decodes the request string before running string matching.
4. Regex Catastrophic Backtracking
If you write a custom regular expression to parse logs, avoid nested quantifiers (e.g., (a+)+). A malformed log line can cause your regex engine to hang, consuming 100% CPU and freezing your local analysis. Stick to simple, non-greedy matches (.*?) or use dedicated log parsers.
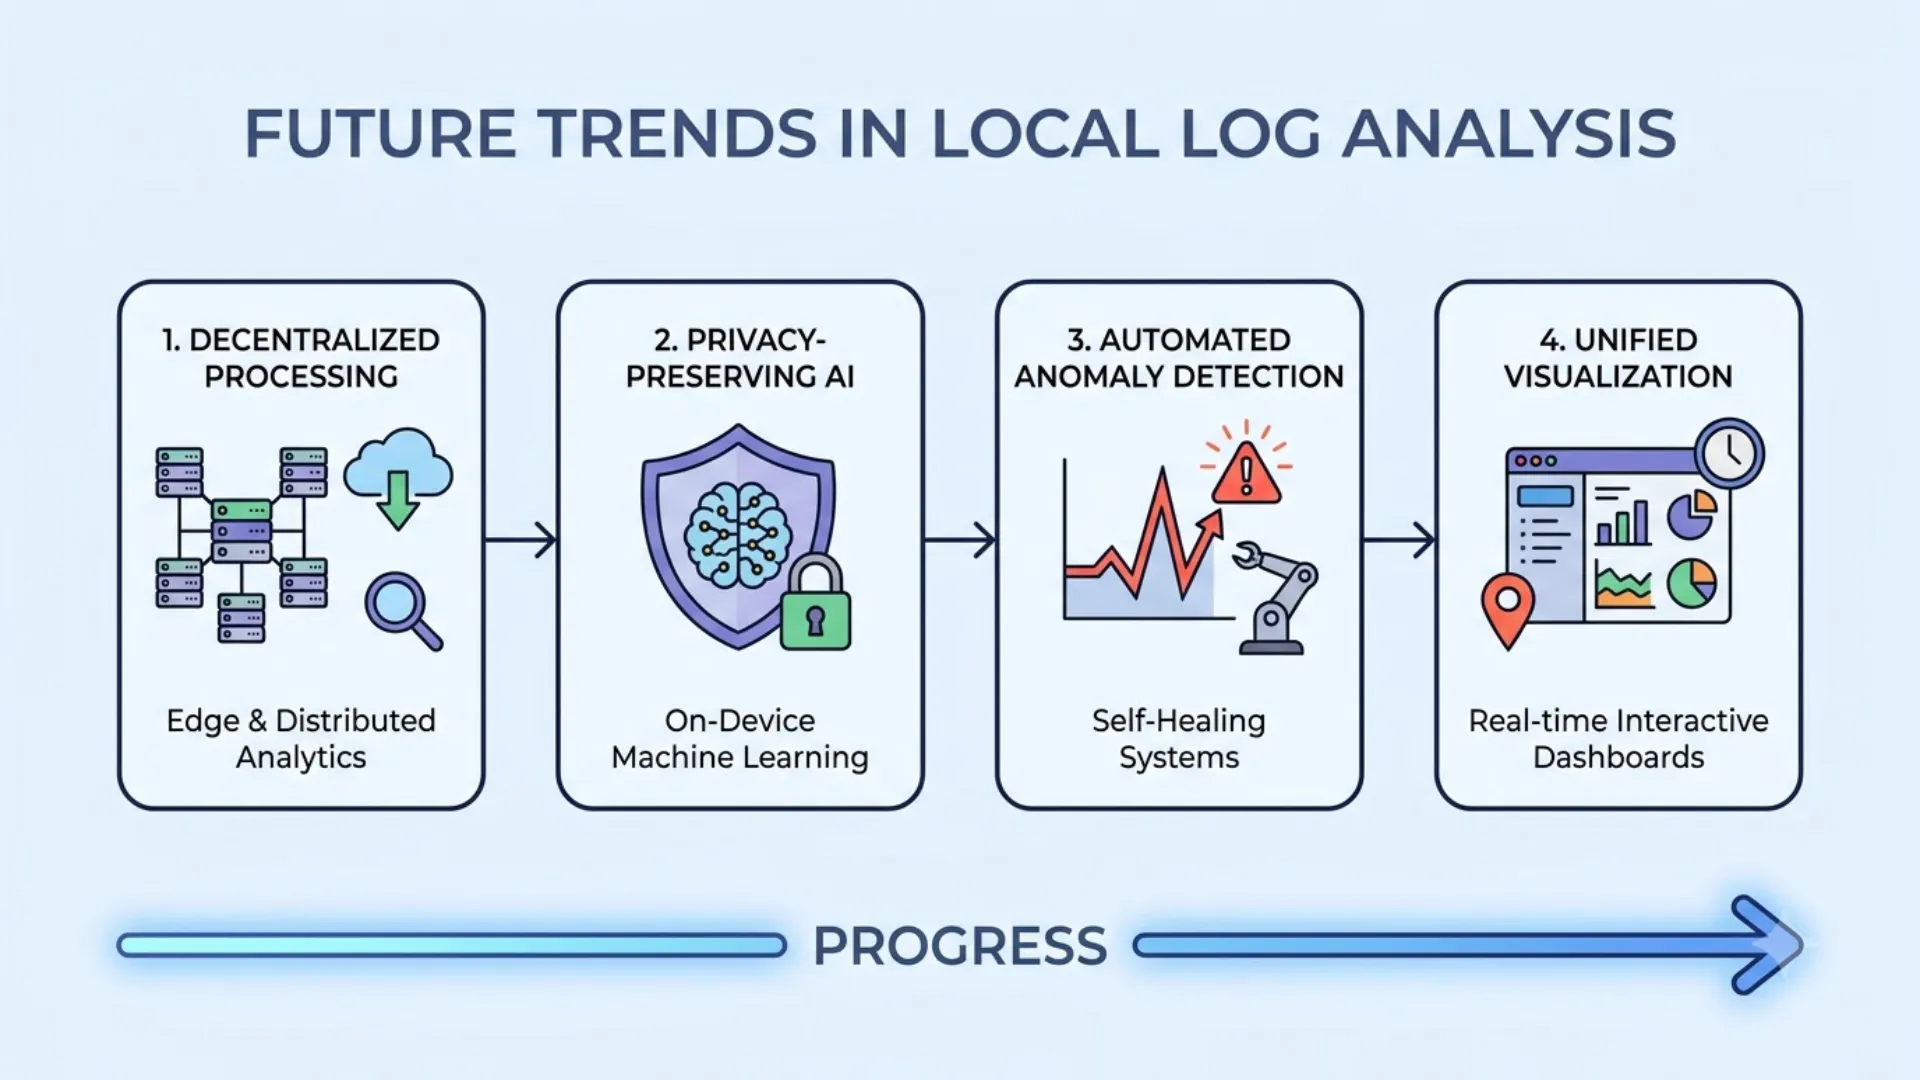
Future Trends in Local Log Analysis
The pendulum is swinging back toward the edge. While centralized logging isn't going away, the tools for local analysis are evolving rapidly.
1. WebAssembly (Wasm) Log Parsers
We are starting to see log parsers compiled to Wasm. This allows you to run highly optimized, Rust-based log parsers directly in the browser. You can drag and drop a 5GB log file into a web page, and the parsing happens locally on your machine via Wasm, with zero data uploaded to a server.
2. Local LLMs for Anomaly Detection
Running a small, quantized Large Language Model (like Llama-3-8B) locally via Ollama is becoming viable on modern laptops. DevOps teams are beginning to pipe local log summaries into local LLMs to ask natural language questions: "Based on these 500 error logs, what is the most likely root cause?" This keeps the forensic analysis entirely offline.
3. eBPF and Pre-Parsing
Instead of analyzing the log file after it's written to disk, tools using eBPF (Extended Berkeley Packet Filter) are intercepting network packets at the kernel level and parsing them in memory. This shifts "local analysis" from the disk I/O layer to the kernel layer, offering unprecedented speed.
Key Takeaways
- Local analysis is a strategic choice: It reduces SaaS costs, keeps PII secure, and provides instant results without waiting for cloud indexers.
- Master the CLI: Advanced
awk,zgrep, andxargsare sufficient for 80% of quick troubleshooting tasks. - Visualize with GoAccess: It’s the best tool for generating quick, beautiful HTML dashboards from raw text files.
- Query with SQL: Use DuckDB as an nginx access log sql parser to run complex, relational queries on raw logs without writing brittle regex.
- Manage memory: Always stream large files. Never load multi-gigabyte logs entirely into RAM.
- Automate locally: Use cron and shell scripts to generate and email daily HTML reports, replacing expensive SaaS dashboards.
Frequently Asked Questions (FAQ)
Can I analyze Nginx logs locally if they are compressed (.gz)?
zgrep for simple searches, or zcat piped into awk or goaccess. For DuckDB, you can use the read_csv function with compression settings, or pipe zcat into DuckDB's standard input.
Is DuckDB safe for production log analysis?
How do I handle logs that contain spaces in the URL?
GET /my path HTTP/1.1). This is why using an nginx access log sql parser like DuckDB with regex extraction is superior to basic awk. The regex "(.*?)" will correctly capture the entire request string, spaces included, because it looks for the bounding quotes.
What is the fastest way to find a specific IP in a 50GB log file?
grep or ripgrep (rg). ripgrep is written in Rust and is significantly faster than standard grep, especially when searching through multiple compressed files. Command: rg "192.168.1.50" -z access.log.* (The -z flag searches compressed files).